CGT270 - Intro to Data Visualization
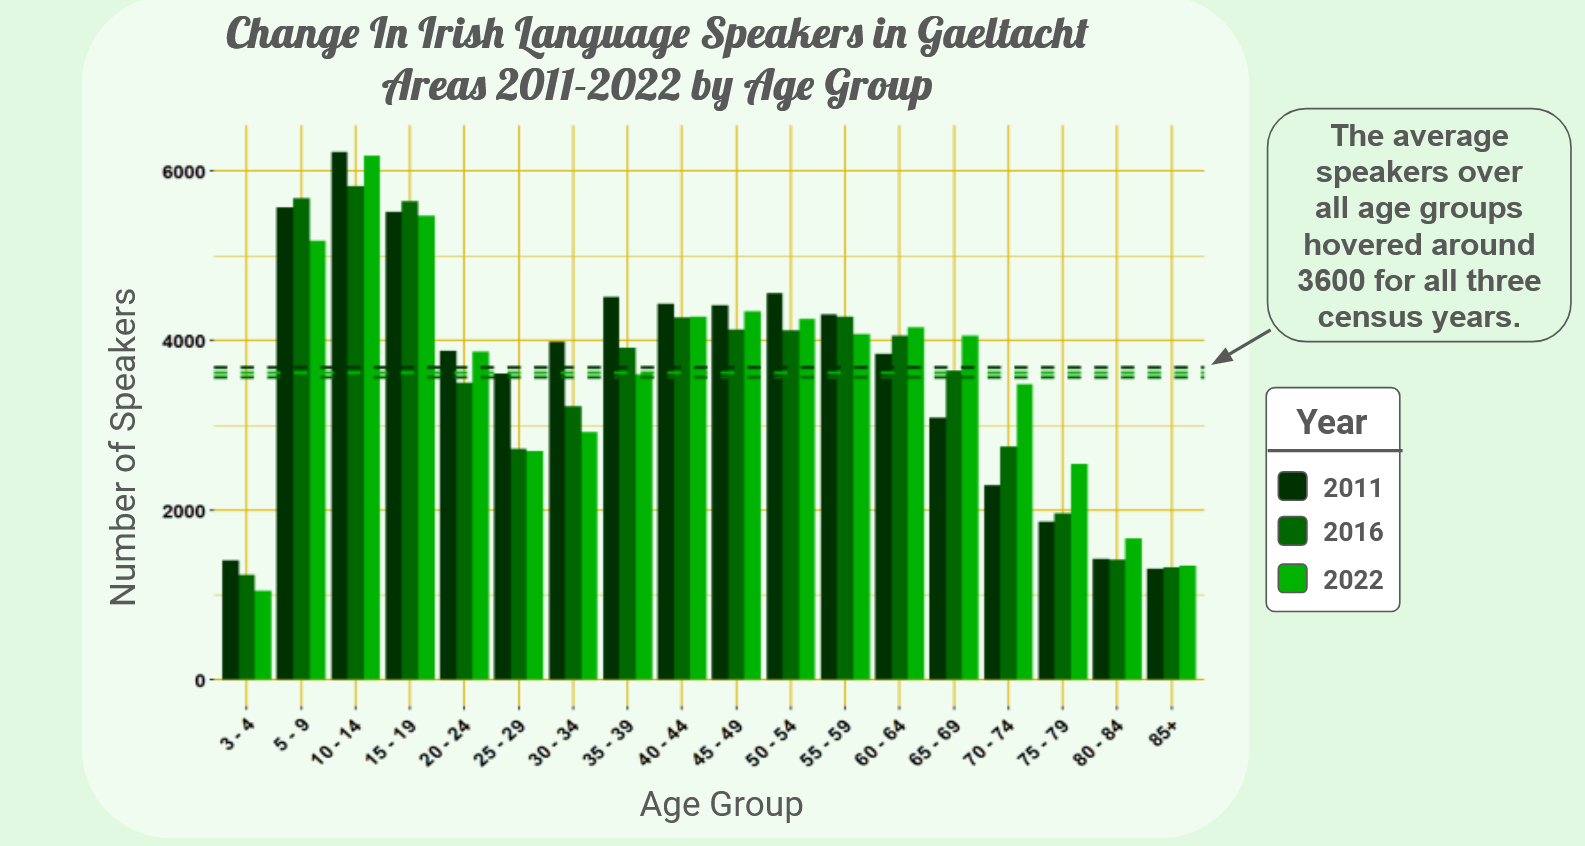
This multi-bar graph shows how the number of Irish speakers in Gaeltacht areas (areas where Irish is spoken more frequently) has changed from 2011-2022. Clearly, the Irish government's efforts to teach kids Irish in school (around the ages of 5-19) is working, however, most are not retaining this skill once they get out of the education system, indicated by the drop in speakers after the age of 20.
Also, the chart makes it clear that the older generation of Irish speakers is not being replaced, as shown by the sharp decline for ages 25-39 and the increase for ages 65-84.
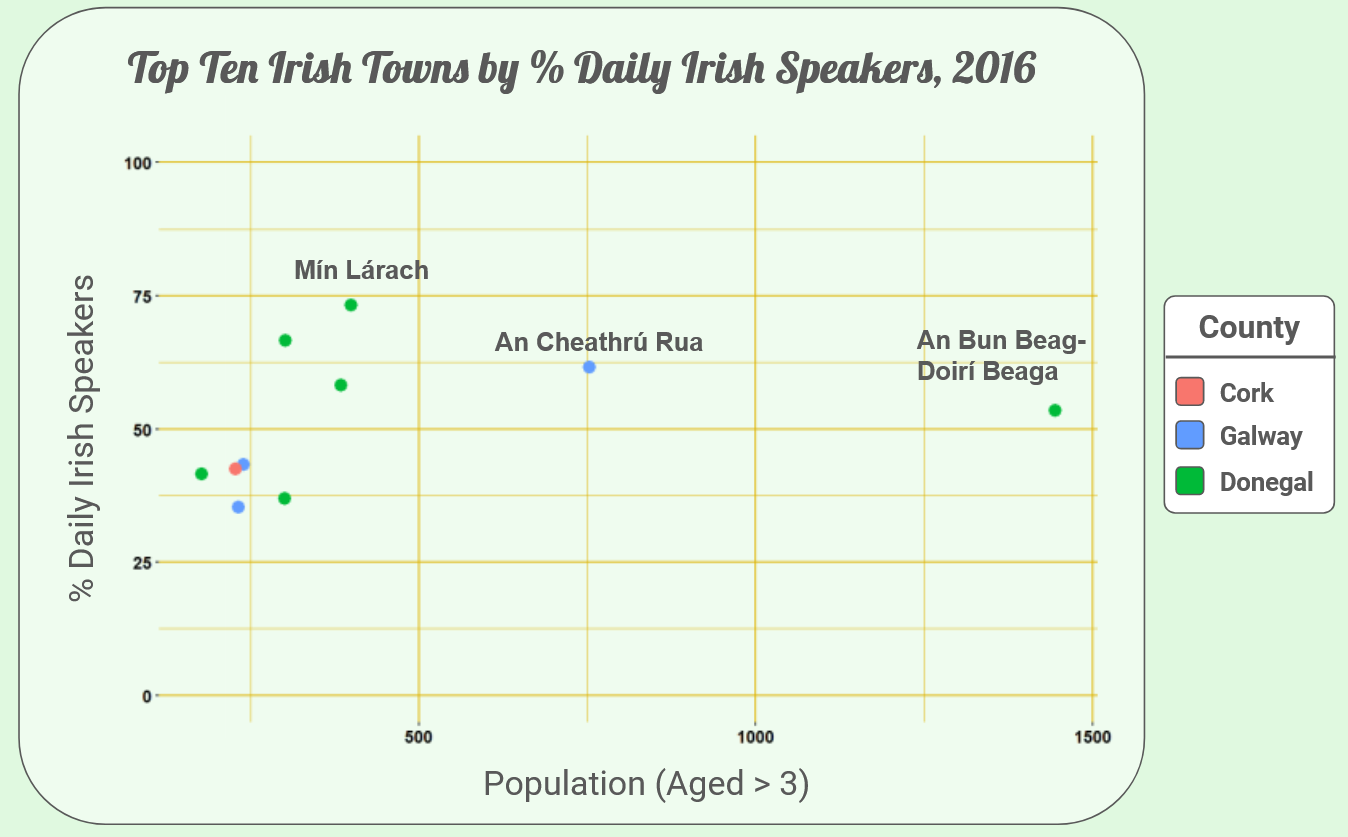
This scatterplot compares the rate at which Irish is spoken daily with the population of the town for the ten towns where Irish is spoken the most. Of these towns, all but two had a population of less than 500, six were in Donegal county, and three were in Galway county. This indicates that Irish is spoken more frequently in small towns that are more likely to have a tight local community.
Worksheet Links
- Click the image below to be taken to this project's website! -
In this project, my main contribution was the group’s website, which is used to host a project summary including a synthesis of our findings, all our visualizations, and information like the team’s contributions & background. Besides this, however, I also made some visualizations of my own that show some insights into topics that I found particularly interesting, including finding relationships between certain subjects or courses and their average GPA.
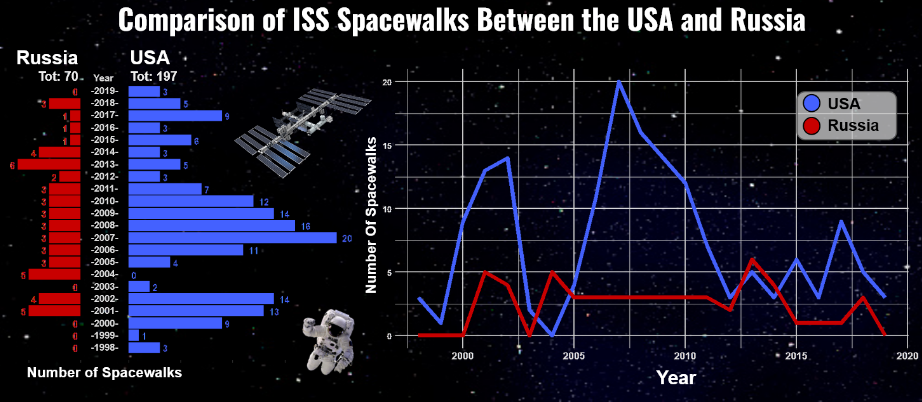
This visualization compares the number of ISS spacewalks between the USA and Russia from 1998 to 2019. The USA usually had more spacewalks per year than Russia, with the exception of years like 2004, 2013, and 2014.
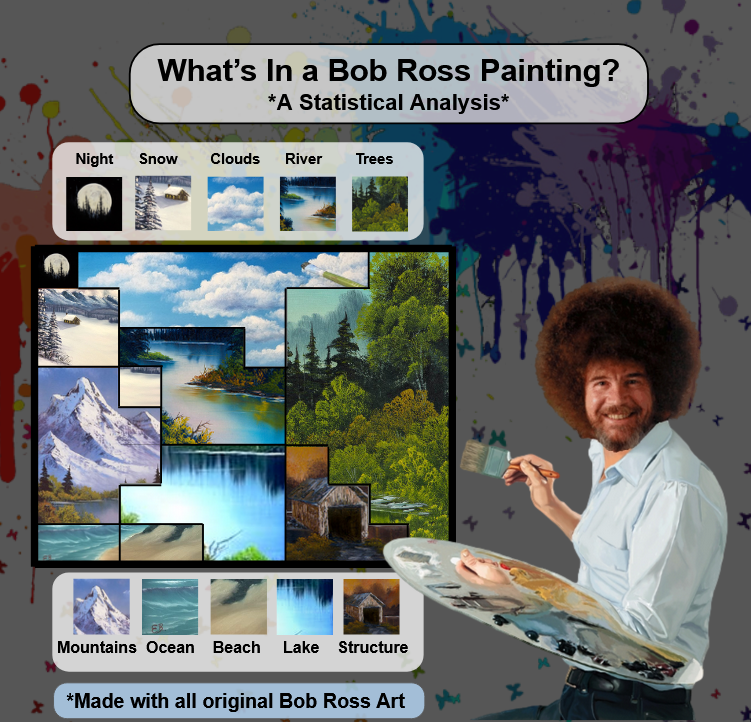
This visualization uses the frequency of each element in The Joy of Painting to reconstruct a statistically accurate Bob Ross painting, with the area of each element proportional to the relative frequency of the element in the show. The chart itself is a waffle chart with original Bob Ross artwork overlaid on the divisions they represent.
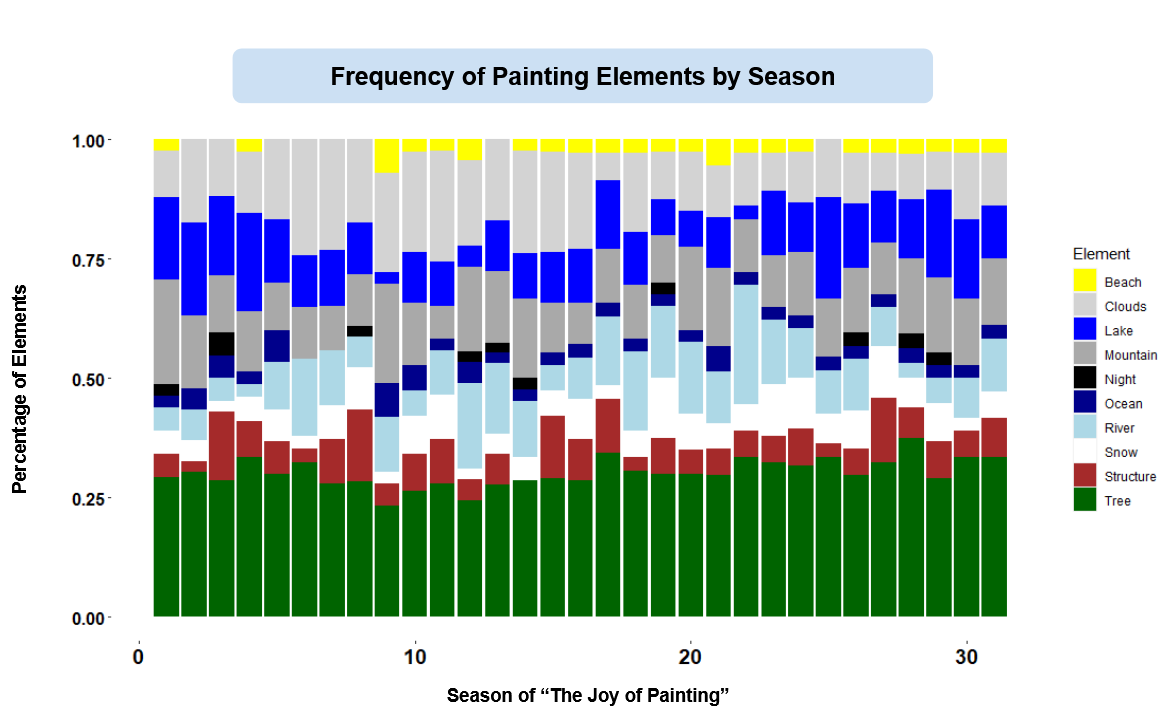
This is a continuation of the Bob Ross analysis where a stacked bar chart is used to break down each season of The Joy of Painting.

This visualization analyzes changes in the UK's exports across multiple economic sectors between 2018 and 2020. Interestingly, exports of machinery and transport equipment fell by about 25% between 2019 and 2020, which coincides with Brexit (which happened in January 2020).
